Logging
Logging#
We will take a look at the available options for logging in ROSA.
- We will look at the logs directly through the pod using
oc logs. - We will forward the logs to AWS CloudWatch and view them from there.
- On cluster logging. This will not be covered in this workshop but you could see more information in the About Logging section of the documentation and follow the steps there to install it if you wish.
Configure forwarding to AWS CloudWatch#
Note
These steps were adopted from our Configuring log forwarding section of the documentation.
The steps to configure ROSA to send logs to CloudWatch is not covered in this lab, as it goes beyond the lab's scope (see the docs above). However, integrating with AWS and enabling CloudWatch logging is an important aspect of ROSA's integration with AWS, so a script has been included to simplify the configuration process. The script will automatically set up AWS CloudWatch. If you're interested, you can examine the script to understand the steps involved.
-
Run the following script to configure your ROSA cluster to forward logs to CloudWatch.
curl https://raw.githubusercontent.com/openshift-cs/rosaworkshop/master/rosa-workshop/ostoy/resources/configure-cloudwatch.sh | bashSample Output:
Varaibles are set...ok. Created policy. Created RosaCloudWatch-mycluster role. Attached role policy. Deploying the Red Hat OpenShift Logging Operator namespace/openshift-logging configured operatorgroup.operators.coreos.com/cluster-logging created subscription.operators.coreos.com/cluster-logging created Waiting for Red Hat OpenShift Logging Operator deployment to complete... Red Hat OpenShift Logging Operator deployed. secret/cloudwatch-credentials created clusterlogforwarder.logging.openshift.io/instance created clusterlogging.logging.openshift.io/instance created Complete. -
After a few minutes, you should begin to see log groups inside of AWS CloudWatch. Repeat this command until you do or continue the lab if you don't want to wait.
Sample Output:
{
"logGroups": [
        {
            "logGroupName": "rosa-mycluster.application",
            "creationTime": 1724104537717,
            "metricFilterCount": 0,
            "arn": "arn:aws:logs:us-west-2:000000000000:log-group:rosa-mycluster.application:*",
            "storedBytes": 0,
            "logGroupClass": "STANDARD",
            "logGroupArn": "arn:aws:logs:us-west-2:000000000000:log-group:rosa-mycluster.application"
        },
        {
            "logGroupName": "rosa-mycluster.audit",
            "creationTime": 1724104152968,
            "metricFilterCount": 0,
            "arn": "arn:aws:logs:us-west-2:000000000000:log-group:rosa-mycluster.audit:*",
            "storedBytes": 0,
            "logGroupClass": "STANDARD",
            "logGroupArn": "arn:aws:logs:us-west-2:000000000000:log-group:rosa-mycluster.audit"
        },
...
Output data to the streams/logs#
-
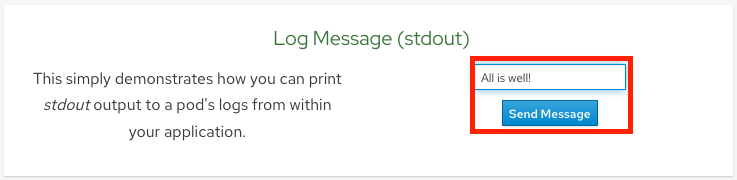
Output a message to stdout Click on the Home menu item and then click in the message box for "Log Message (stdout)" and write any message you want to output to the stdout stream. You can try "All is well!". Then click "Send Message".
-
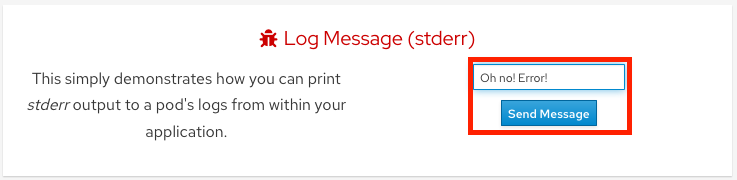
Output a message to stderr Click in the message box for "Log Message (stderr)" and write any message you want to output to the stderr stream. You can try "Oh no! Error!". Then click "Send Message".
View application logs using oc#
-
Go to the CLI and enter the following command to retrieve the name of your frontend pod which we will use to view the pod logs:
So the pod name in this case is ostoy-frontend-679cb85695-5cn7x.
-
Run
oc logs ostoy-frontend-679cb85695-5cn7xand you should see your messages:
You should see both the stdout and stderr messages.
View logs with CloudWatch#
- Access the web console for your AWS account and go to CloudWatch.
-
Click on Logs > Log groups in the left menu to see the different groups of logs depending on what you selected during installation. If you followed the previous steps you should see 3 groups. One for
rosa-<CLUSTER_NAME>.application,rosa-<CLUSTER_NAME>.audit, androsa-<CLUSTER_NAME>.infrastructure.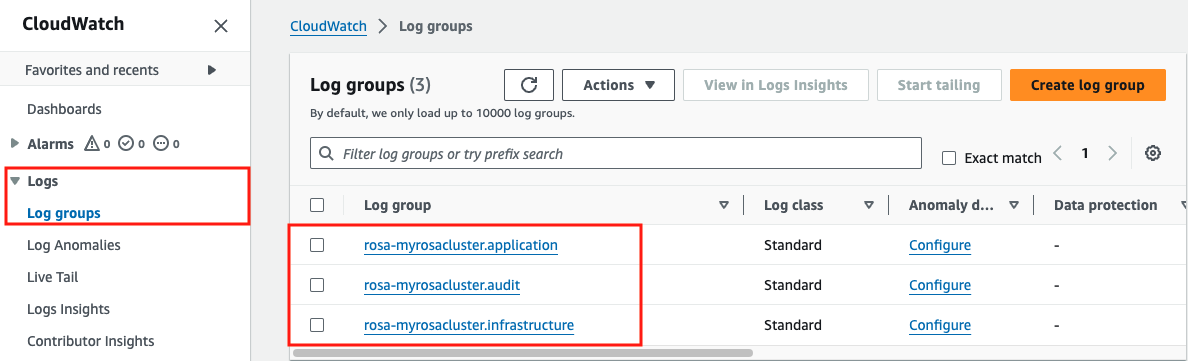
-
Click on
rosa-<CLUSTER_NAME>.application -
Click on the log stream for the "frontend" pod. It will be titled something like
kubernetes.var[...]ostoy-frontend-[...]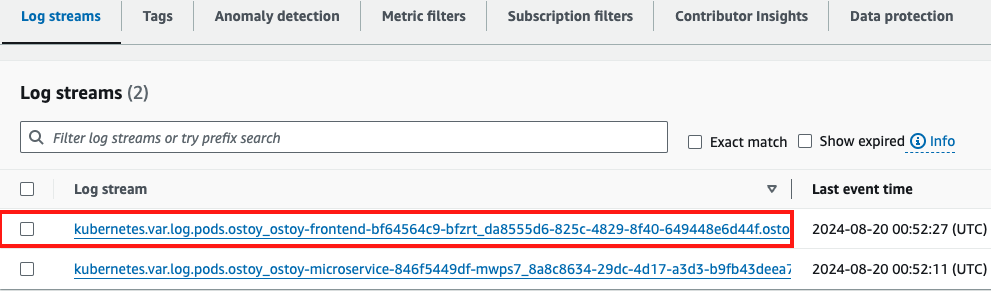
-
Filter for "stdout" and "stderr" the expand the row to show the message we had entered earlier along with much other information.
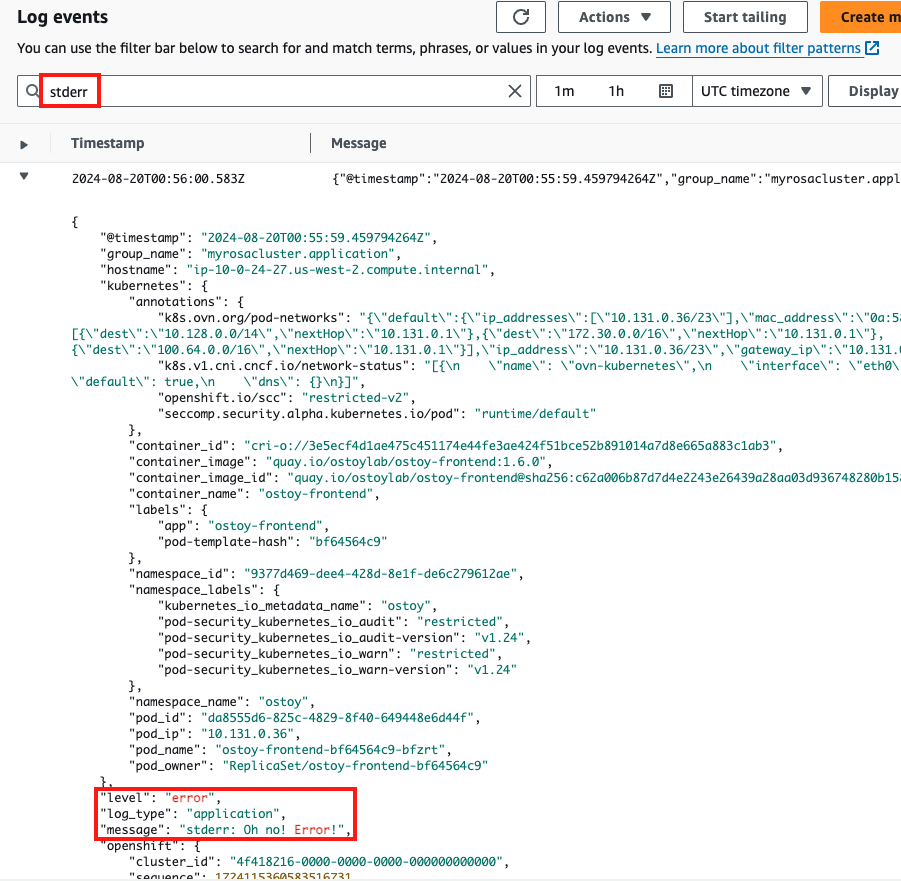
-
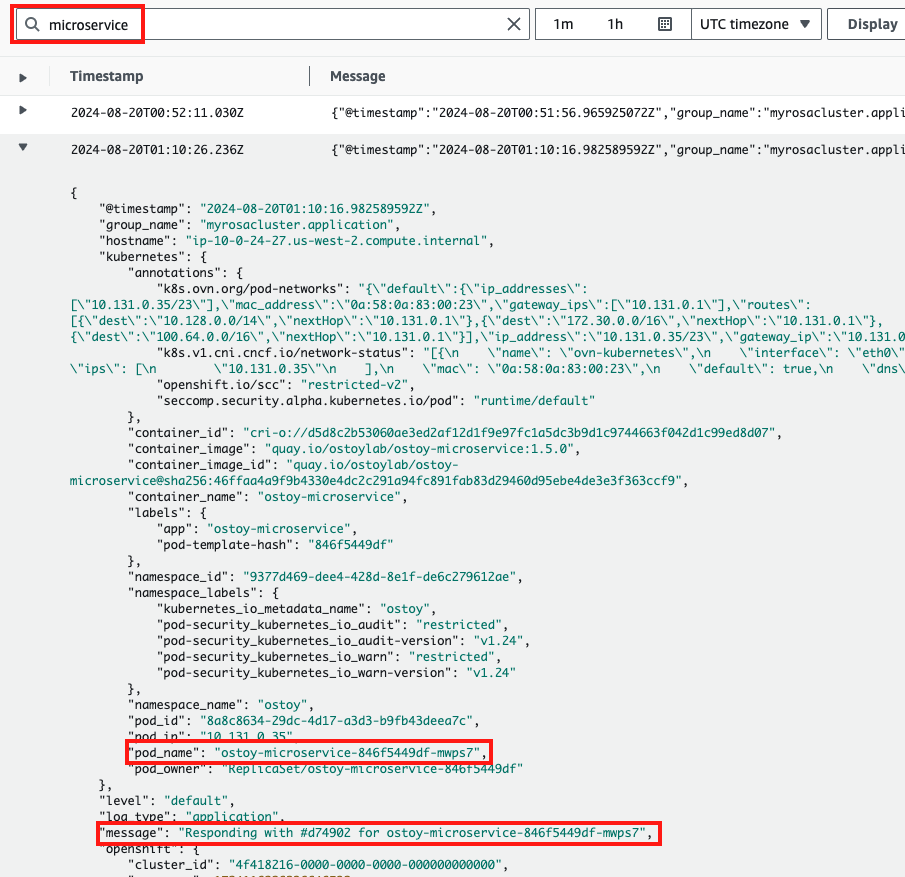
We can also see other messages in our logs from the app. Return to the LogStreams and select the microservice pod. Enter "microservice" in the search bar, and expand one of the entries. This shows us the color received from the microservice and which pod sent that color to our frontend pod.
You can also use some of the other features of CloudWatch to obtain useful information. But AWS CloudWatch is beyond the scope of this tutorial.